pg_stat_statements PGSQLPhriday
With Michael of pgMustard fame current host of #PGSQLPhriday, I could not resist revisiting this rather abondoned place of the interweb. As a short prelude, PGSQL Phriday is a blog event to talk of all things PostgreSQL and this week topic is about pg_stat_statements.
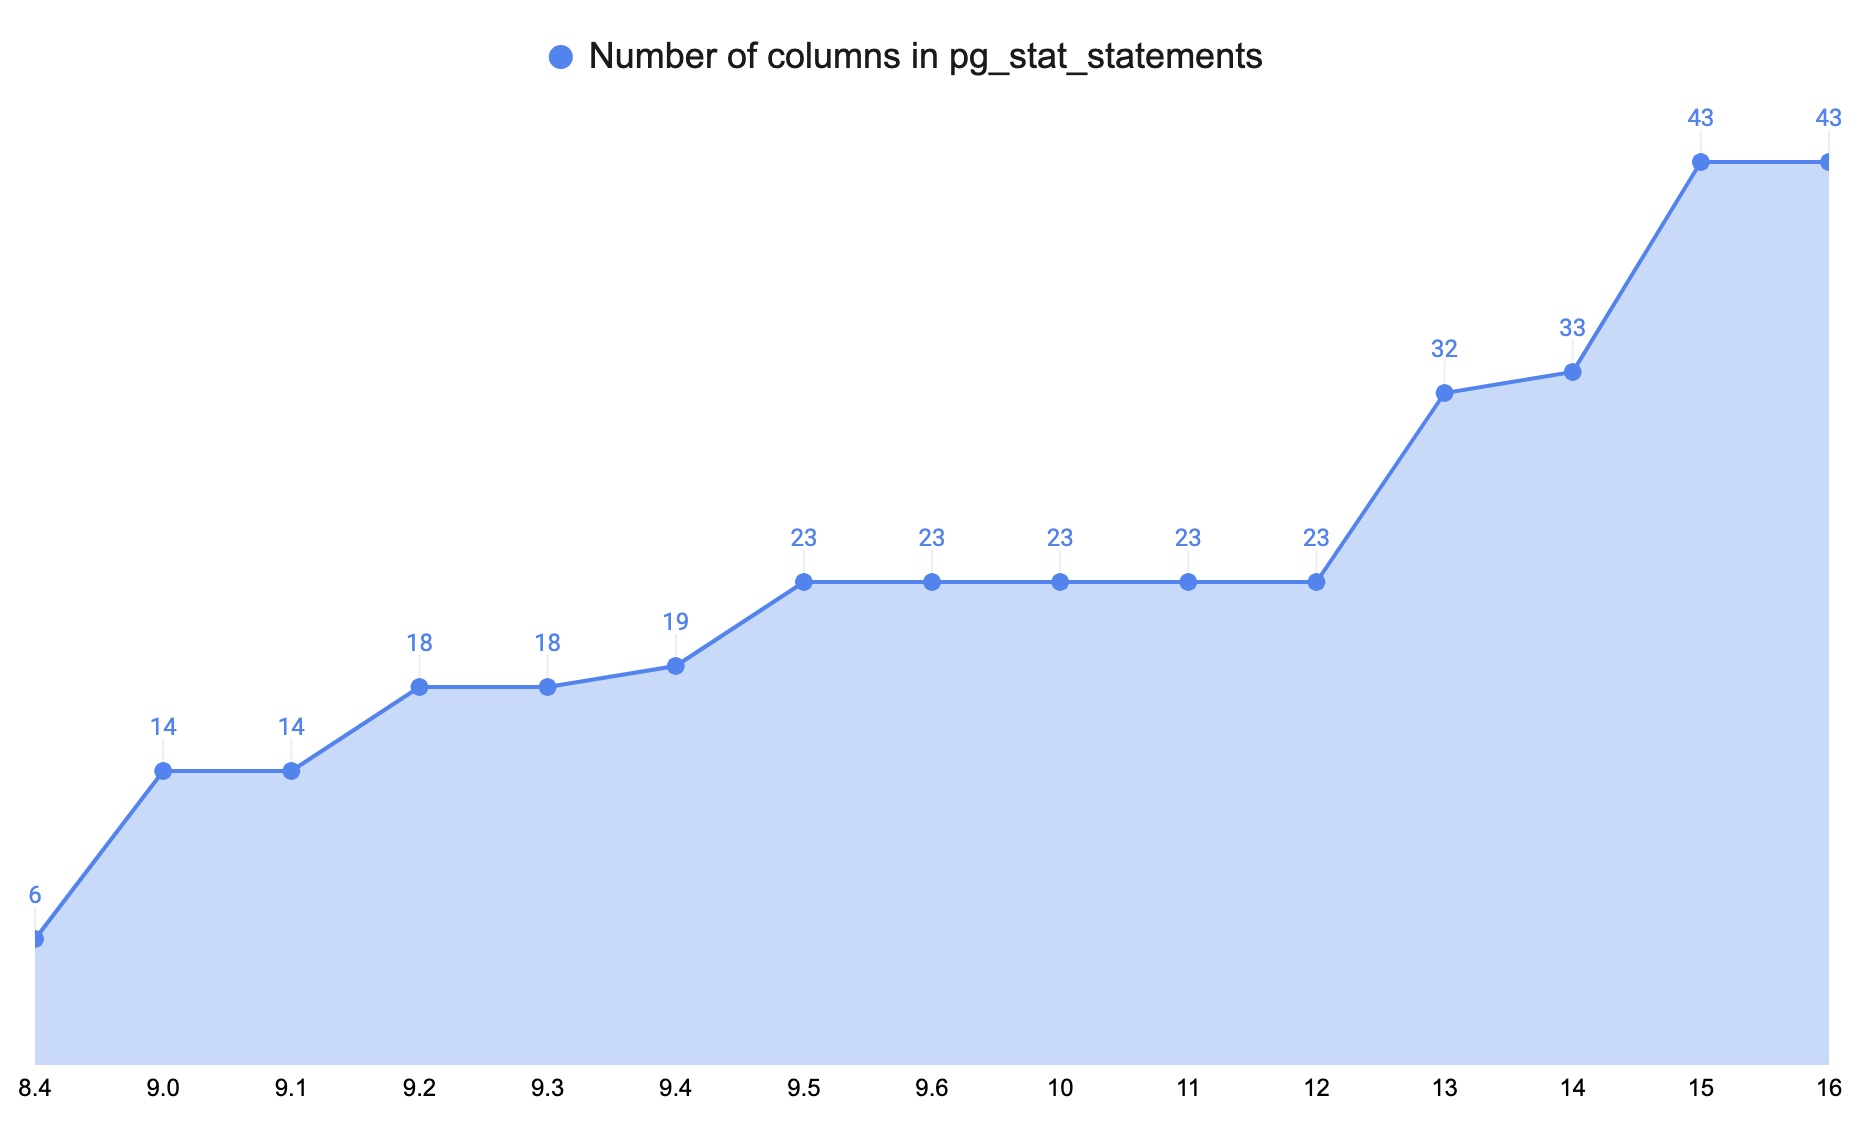
pg_stat_statement is a module available since 2009 in Postgres 8.4. It tracks execution statistics on all SQL statements that have been executed. Since version 13, it also tracks planning statistics. As like most things on earth, it has grown a lot since its birth and to give you an idea, here is the evolution of the number of columns in its view:
If you are serious about your database performance, I have trouble imagining you can do without it. It will help you identify slow queries, queries that are generating copious amounts of temporary blocks, queries that took most cpu time … So while it’s not a free lunch, its benefits far outweight its drawbacks in my opinion.
How do I like to use it ? When I want to improve the cluster’s health, total_[exec_]time is what I am most often looking after. At the top of this list, you might find long queries, shorts queries called very often, but you will understand what is taking your precious server time. mean_[exec_]time is also very interesting. Provided there are called enough time, those might be the exact queries your users are complaining about when they tell you that “the app is slow”.
Here is one such good start, taken from https://www.cybertec-postgresql.com/en/pg_stat_statements-the-way-i-like-it/ :
SELECT substring(query, 1, 50) AS short_query,
       round(total_exec_time::numeric, 2) AS total_exec_time,
       calls,
       round(mean_exec_time::numeric, 2) AS mean,
       round((100 * total_exec_time /
       sum(total_exec_time::numeric) OVER ())::numeric, 2) AS percentage_cpu
FROM pg_stat_statements
ORDER BY total_exec_time DESC
LIMIT 20;
Some thoughts on my usage:
- cast some columns time to integer (or numeric with 2 decimals) for easier reading.
- if you do a big application release, it might be useful to use pg_stat_statements_reset(). The queries might have changed drastically and the cumulative view might make it not very noticeable.
- export it so you have a better idea how things evolved over time. Several other RDBMS users have had Active Session History (ASH) for some time and while exporting the view to compare with a previous state is not the same thing, it will reveal important information.
- you might not want to retain too many queries in it (see pg_stat_statements.max) .
- make it part of a default PostgreSQL installation.
So far it is not part of core PostgreSQL (it remains a contrib module), but I still hope this will change some lucky day.